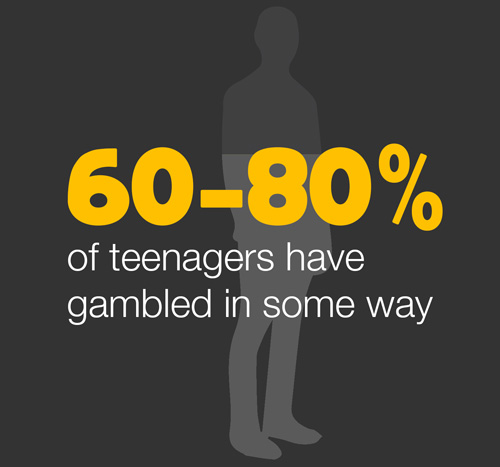
Refugee youth
Topics
New beginnings: Life in Australia 2005–2006
Children in immigration detention 1999–2003
Young refugees, 2000–01
Young people in immigration detention centres, 2001
Children of asylum seekers held in Australian detention centres, 2003
Time in detention centres, April 2002
Young arrivals in Australia under Humanitarian Program 1991–2000
viewed 23 April 2008.)
New beginnings: Life in Australia 2005–2006
The Australian government provides a comprehensive range of settlement services for 13,000 humanitarian entrants and other eligible migrants each year.
A significant proportion of the current humanitarian intake is young.
In 2005–06 about 66% were under the age of 25 and about 42% were under the age of 15.
Source: Department of Immigration and Multicultural Affairs, New Beginnings: Life in Australia: Supporting new arrivals on their settlement journey 2005–06 [viewed 20/9/2007].
Children in immigration detention 1999–2003
Between 1999 and 2003, 2,184 children were held in detention. More than 90% of them were eventually found to have a legitimate claim to refugeee status.
Children in immigration detention in 1999–2000: 976
… in 2000–01: 1,923
… in 2001–02: 1,696
… in 2002–03: 703
On 26 December 2003: 111
Most of these children arrived by boat.
From late January 2000, most unaccompanied asylum-seeker children were transferred from immigration detention centres to 'alternative places of detention' such as foster homes in the community.
Where children were held between July 1999 and July 2003:
Detention Centre | 1.7.99 | 1.1.00 | 1.7.00 | 1.1.01 | 1.7.01 | 1.1.02 | 1.7.02 | 1.1.03 | 1.7.03 |
Curtin | - | 147 | 133 | 167 | 153 | 63 | 33 | - | - |
Port Hedland | 27 | 91 | 142 | 64 | 128 | 85 | 11 | 20 | 14 |
Woomera | - | 118 | 215 | 16 | 304 | 281 | 45 | 11 | - |
Woomera Housing Project |
- | - | - | - | - | 7 | 0 | 6 | 10 |
Villawood | 19 | 32 | 32 | 28 | 37 | 16 | 14 | 32 | 29 |
Maribyrnong | 11 | 9 | 4 | 11 | 7 | 3 | 10 | 3 | 5 |
Perth | 0 | 0 | 0 | 0 | 0 | 0 | 1 | 0 | 1 |
Christmas Island | - | - | - | - | - | 79 | 10 | 5 | - |
Cocos K. Islands | - | - | - | - | - | 5 | - | - | - |
Baxter | - | - | - | - | - | - | - | 38 | 41 |
Other (hospitals, etc.) |
1 | 2 | 16 | 1 | 2 | 4 | 14 | 17 | 11 |
Total number of children in detention |
58 | 399 | 542 | 287 | 631 | 543 | 138 | 132 | 111 |
At the beginning of 2003, the average detention period for a child was 15 months and 17 days.
At 26 December 2003 it was 20 months and 11 days.
Between 1 July 1999 and 30 June 2003, 37% of asylum seeker children in detention were girls. The majority of children in detention were under 12.
Children in immigration detention centres by age:
Age of children as at 30 June each year |
0–4 years | 5–11 years | 12–17 years |
1999 | 23 | 15 | 23 |
2000 | 164 | 208 | 162 |
2001 | 144 | 210 | 278 |
2002 | 33 | 54 | 53 |
2003 | 32 | 29 | 52 |
Most of the children in detention 1999–2003 were from Iraq, Afghanistan, Iran, the Palestinian territories and Sri Lanka.
Number of asylum-seeking children arriving in Australia without a valid visa between 1 July 1999 and 30 June 2003: 2,184
Percentage found to be refugees and granted temporary protection visas: over 92%
(including 98% of Iraqi children and 95% of Afghan children)
These figures do not include children transferred to and detained on Nauru and Manus Island (Papua New Guinea).
Number of asylum-seeking children arriving in Australia with a valid visa between 1 July 1999 and 30 June 2003: 3,125
Percentage found to be refugees: 25%
Source: Human Rights and Equal Opportunities Commission 2004: A Last Resort – Summary Guide – A summary of the important issues, findings and recommendations of the National Inquiry into Children in Immigration Detention, HREOC, Sydney [viewed 25/01/2007].
Back to top
Young refugees, 2000–01
Number of refugees aged 12 to 25 years who came to Australia in 2000–01: 3,853
58.8% came through the offshore component and 41.2% through the onshore component of the Humanitarian Program.
Number on temporary protection visas: 1,462
(The largest group of all refugee young people, representing 43% of all temporary protection visas granted for that year.)
In the Offshore Program, half (51.4%) came as refugees and 39.1% through the Special Humanitarian Program. The remainder (9.5%) came through the Special Assistance Category.
Number of young people who were unauthorised arrivals in Australia in 2000–01: 1,266
Percentage of unauthorised arrivals: 31%
Percentage of all detained young asylum seekers recognised as refugees: 83%
There were 218 young people under 18 years in the Humanitarian Unaccompanied Minors Scheme in May 2001. 48% were unauthorised arrivals who had been granted temporary protection visas.
Estimated number of young people with refugee experience in Australia in 2003: 16,000– 20,000
Source: Susan Pitman, et al. 2004, Profile of young Australians: Facts, figures and issues [viewed 25/01/2007], Foundation for Young Australians, Melbourne, pp.43–4.
Young people in immigration detention centres, 2001
Percentage of people in immigration detention centres in April 2002 aged under 18: 11.2%
… number aged between 18 and 25 years: not known
… of the 184 minors in immigration detention, 81 were aged 12–17 (44%)
Young asylum seekers from Iran made up the largest group in detention (38%) followed by those from Afghanistan (28%) and Iraq (16%).
Just on two-thirds of all minors had been in detention nine months or more in April 2000 (64.7%). Young detainees under 18 years made up 11.9% of all those who had been in detention for more than 18 months.
Source: Susan Pitman, et al. 2004, Profile of young Australians: Facts, figures and issues, Foundation for Young Australians, Melbourne, pp.44–5. Available online [viewed 25/01/2007] in pdf format.
Children of asylum seekers held in Australian detention centres, 2003
Number of accompanied minors held in Immigration Reception and Processing Centres, Offshore Processing Centres, and Urban Immigration Detention Centres as at 13/11/03:
Baxter: 22
Port Headland: 15
Christmas Island: 15
Woomera: 7
Nauru: 89
Maribyrnong: 1
Perth: 0
Villawood: 32
Back to top
Time in detention centres, April 2002
The following table shows the amount of time that minors (aged 18 or less) had spent in immigration detention centres as at April 2002:
Time in detention centre |
Percentage of minors |
0–3 months | 7% |
3–6 months | 6% |
6–9 months | 23% |
9–12 months | 20% |
12–18 months | 29% |
18 months or more | 15% |
Source: Adapted from a chart reproduced in Susan Pitman, et al. 2004, Profile of young Australians: Facts, figures and issues, Foundation for Young Australians, Melbourne, p.45. Available online [viewed 25/01/2007] in pdf format.
Young arrivals in Australia under Humanitarian Program 1991–2000
Number of young people (12-24) who arrived in Australia under the Humanitarian Program as permanent residents between 1991 and 2000: 25,000
Table 1: Young people aged 12–24 years, entering Australia under the Humanitarian Program, by age group, 1991–2000
12-15 years | 16-17 years | 18-24 years | Total | |
1991 | 499 | 248 | 1149 | 1896 |
1992 | 581 | 306 | 1613 | 2500 |
1993 | 659 | 319 | 1490 | 2468 |
1994 | 810 | 386 | 1769 | 2965 |
1995 | 1040 | 445 | 1779 | 3264 |
1996 | 838 | 380 | 1359 | 2577 |
1997 | 671 | 306 | 881 | 1858 |
1998 | 1210 | 486 | 1259 | 2955 |
1999 | 831 | 373 | 878 | 2082 |
2000 | 756 | 372 | 939 | 2067 |
Table 2: Young people aged 12–24 years, entering Australia under the Humanitarian Program, by region/ country of birth, 1991–2000
Europe & Baltic |
Middle East | Africa | Asia | South & Central America |
Total | |
1991 | 29 | 384 | 67 | 941 | 248 | 1896 |
1992 | 511 | 846 | 173 | 818 | 152 | 2500 |
1993 | 956 | 249 | 279 | 915 | 65 | 2468 |
1994 | 1074 | 496 | 276 | 1062 | 42 | 2965 |
1995 | 1379 | 834 | 251 | 741 | 59 | 3264 |
1996 | 1304 | 390 | 289 | 551 | 35 | 2577 |
1997 | 803 | 406 | 282 | 349 | 18 | 1858 |
1998 | 1408 | 675 | 444 | 419 | 9 | 2955 |
1999 | 844 | 616 | 342 | 274 | 6 | 2082 |
2000 | 933 | 494 | 394 | 235 | 11 | 2067 |
Small discrepancies between the total of the regional figures and the total intake of young humanitarian entrants are due to a small number of cases where information was missing at the time the settlement database was compiled.
Statistics from the National Settlement Database, produced by the Department of Immigration and Multicultural and Indigenous Affairs, are presented in a report which includes a statistical profile of young refugees in Australia. These statistics, the report notes, do not account for young people who arrive under the Family Stream of the Migration Program, or those on temporary protection visas.
Source: Coventry, L., Guerra, C, Mackenzie, D & Pinkney, S. 2002, Wealth of All Nations: Identification of strategies to assist refugee young people in transition to independence, National Youth Affairs Research Scheme, Hobart, pp. 29-34. NYARS reports are available for download from the FaHCSIA website.Back to top